
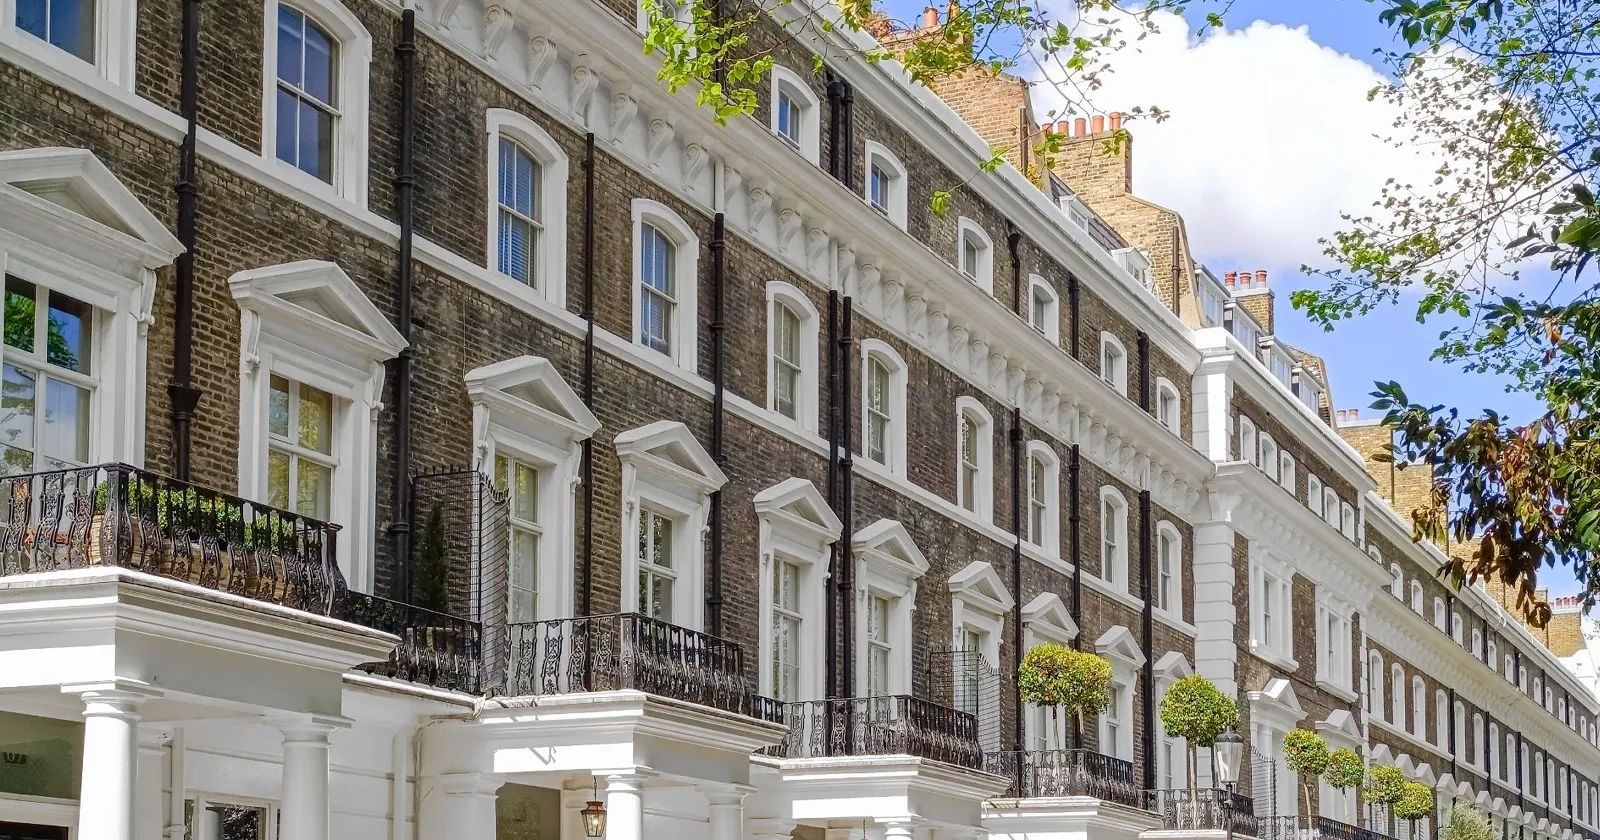
Welcome to Llanover International’s Summer 2026 Property Market Review.
Llanover International advises clients across London and prime Surrey – including St George’s Hill, Wentworth Estate and the wider Elmbridge area – as well as Singapore and the United Arab Emirates.
Over the first six months of 2026 each market has encountered considerably differing geopolitical and economic headwinds.
In all three markets the best assets have stopped following the market they sit in. That divergence, and what it means for buyers and sellers are what we consider in this review and outlook.
London
Price pressure persists, but the pace may be stabilising
The next quarter will favour the disciplined buyer; reviewing activity over the year to date highlights why.
Knight Frank has prime central London prices down 3.6% in the year to June, unchanged for a second month, the first time in over a year the rate of decline has held rather than steepened.
Savills puts the market 24.5% below its 2014 peak, and the currency has moved the same way over the same period, from near 1.65 to the dollar in 2014 to roughly 1.34 today. Sterling is also materially weaker against the dollar than it was around the 2014 market peak, further improving relative value for dollar-linked buyers.
Underneath the prices, buyers are more active than the transaction count suggests. Sales fell 14% in the year to June while offers made fell only 4%. The smaller decline in offers suggests a fuller pipeline than the completed-sales figure alone implies, although political and financing uncertainty is still delaying conversion.
It is also why, despite what headlines might have you believe, it is the buyer that sets the price. The average discount from initial asking price reached 10.4% in June, and more than half of everything sold that month had already taken a reduction. The figures reinforce the cost of testing the market at an aspirational price: sellers who launch too high are increasingly having to make visible reductions before securing a buyer.
Where the trophy money came from
The top behaved quite differently from the market beneath it. June ended a weak first half on a firmer note at the top of the market. LonRes recorded transactions above £5 million up 7.1% year on year during the month, while new instructions fell 17.3%. Across H1 as a whole, however, sales in the bracket remained 14.7% lower than a year earlier.
Two sales have caught considerable attention: Providence House in Chelsea sold for a reported sum of more than £265 million in April, setting a new UK residential record. In June, Abbas Sajwani was reported to be nearing a £190 million purchase of The Holme in Regent’s Park, which would rank among the UK’s largest residential transactions.
The latest research and data however highlight that this is not a repeat of the 2009 pattern, in which instability drove overseas capital into prime central London sales. Since February that overseas demand has shown up in lettings instead, with super prime rentals above £5,000 per week up 8% over the year while tenancies overall fell 2%.
Some internationally mobile demand is appearing first in the rental market, where high-value tenants are prioritising flexibility while the political and tax outlook remains unsettled.
An outlook shaped in Westminster
London enters Q3 with an incoming government, no settled fiscal direction and renewed debate over property taxation. Until the next Budget clarifies that position, uncertainty itself is likely to continue delaying discretionary transactions.
Savills cut its prime central London forecast to minus 3.0% for the year in June, citing mortgage rates, geopolitics and domestic political instability together. Knight Frank moved to minus 2%, from flat.
Renewed pressure on energy prices has increased expectations that UK rates may remain higher for longer, with the possibility of further tightening returning to the market debate.
In our view London is bottoming rather than recovering, and little will resolve before the Autumn Budget. For anyone with cash and patience, that is not a warning. It is the window.
“Prime central London is not yet recovering, but the pace of decline may be stabilising. For dollar-linked buyers, sterling’s weakness compounds a market already around a quarter below its 2014 peak. The opportunity is selective: exceptional homes still attract competition, while compromised or overpriced stock remains exposed.”
Prime Surrey: Borough averages conceal a highly segmented market
Surrey’s prime market also requires a more selective reading than the headline figures suggest. The average Elmbridge house price stood at £741,000 in April 2026, 1.9% lower than a year earlier, although detached homes averaged £1.545 million. Elmbridge nevertheless remained the highest-priced local authority in the South East.
Those borough-wide figures provide context, but they are a blunt guide to private estates such as St George’s Hill and Wentworth Estate, where plot, position, condition, specification and scarcity can create substantial differences between individual homes. Savills reports that prime Surrey values rose 18% from March 2020 before falling 15% following the September 2022 mini-Budget, leaving net growth of just 0.8% over six years. Even so, agreed sales above £2 million were 4% higher year on year in May, suggesting that committed buyers remain active when the property and price are aligned.
North Surrey continues to attract both domestic and international demand. Approximately one-third of buyers come from London, while overseas buyers account for around a quarter of sales. For sellers, this remains a market in which accurate initial pricing and presentation are critical.
For buyers, more subdued competition may create opportunities, but the strongest homes on established private estates are unlikely to follow the wider borough average.
Sources: Knight Frank Prime Central London Index, June 2026; LonRes; Savills UK residential forecasts, June 2026; Financial Times, 25 June 2026; Bank of England. Office for National Statistics, Housing Prices in Elmbridge, June 2026; Savills, The Prestige of Surrey, July 2026.

Singapore
Two markets, one city
The luxury segment of the Singapore property market reached a four year high inside a market that was otherwise in retreat.
Realion (OrangeTee & ETC) Group recorded recorded 353 transactions at S$5m and above in the prime Core Central Region over the first half of 2026, up almost a quarter on the same period last year. Knight Frank Singapore, looking only at large prime apartments, counted 128 sales at an average of S$2,689 psf, a price up 8.3% on the previous half on marginally lower volume. The combination of higher average pricing and broadly stable volumes is consistent with constrained prime supply, although differences in the mix of homes sold may also have influenced the average.
The wider market went the other way, with private home sales down 12% across the half. The quarterly index makes the split unmistakable. Overall prices rose 0.5% in the second quarter, but that average conceals a Core Central Region up 2.0% against a city fringe down 1.4% and suburbs down 0.2%. Above S$10m the picture is starker still: twenty-three transactions in the second quarter, the highest in fifteen.
Who is buying property in Singapore?
The interesting question in Singapore is not how much but who. Additional Buyer’s Stamp Duty for foreigners has stood at 60% since April 2023 and foreign participation duly collapsed, from a 17% share of new home purchases across 2015 to 2022 down to 4.7% this year.
On any conventional reading the prime market should have followed it down but it did the opposite.
New Core Central Region sales rose fivefold last year, to 1,916 from 378. Local buyers filled the entire gap, helped along by the price premium over the city fringe narrowing to a tenth from a fifth.
Knight Frank Singapore attributes the prime demand to newly granted citizens and permanent residents converting out of tenancies into ownership, and government policy keeps that pipeline filled: Singapore intends to grant citizenship to between 25,000 and 30,000 people a year for the next five.
This gives the prime market a more domestically anchored demand base than it had before the 60% foreign-buyer surcharge.
It is worth noting that US nationals and citizens of the European Free Trade Association (EFTA) member states (Switzerland, Norway, Iceland, and Liechtenstein) have trade agreements with Singapore that accord them the same stamp duty treatment as Singapore Citizens, meaning that no ABSD applies to a first residential purchase and reduced rates for subsequent purchases similar to Singapore citizens.
Outlook for the Singapore market
Supply governs the quarter ahead. ERA expects approximately 3,200 private homes to launch in the second half, of which 768, around 24%, will be in the CCR. A further 420 executive-condominium units take the combined launch pipeline to 3,620. Dunearn House arrives in July as the first launch in the Bukit Timah Turf City precinct, and the comparison should improve on that alone. ERA holds a full year forecast of 3% to 5% price growth.
The collective-sale market has revived, although the failure of High Point’s S$580 million tender to secure an immediate buyer shows that developers remain selective.
The risk is external and it cuts both ways. Escalation in the Middle East raises energy and construction costs while accelerating the very wealth transfer that has been driving prime demand. Both effects are live at once.
“Singapore’s prime market is increasingly supported by citizens and permanent residents rather than foreign buyers. With only 768 CCR units expected in the second-half private launch pipeline, scarcity should continue to support well-located projects. That does not make the market indiscriminate: price, product and tenure will still determine performance.”
Sources: Realion (OrangeTee & ETC) Research via The Business Times, 13 July 2026; Knight Frank Singapore; URA flash estimates, 1 July 2026; ERA Research and Market Intelligence; Huttons Asia.
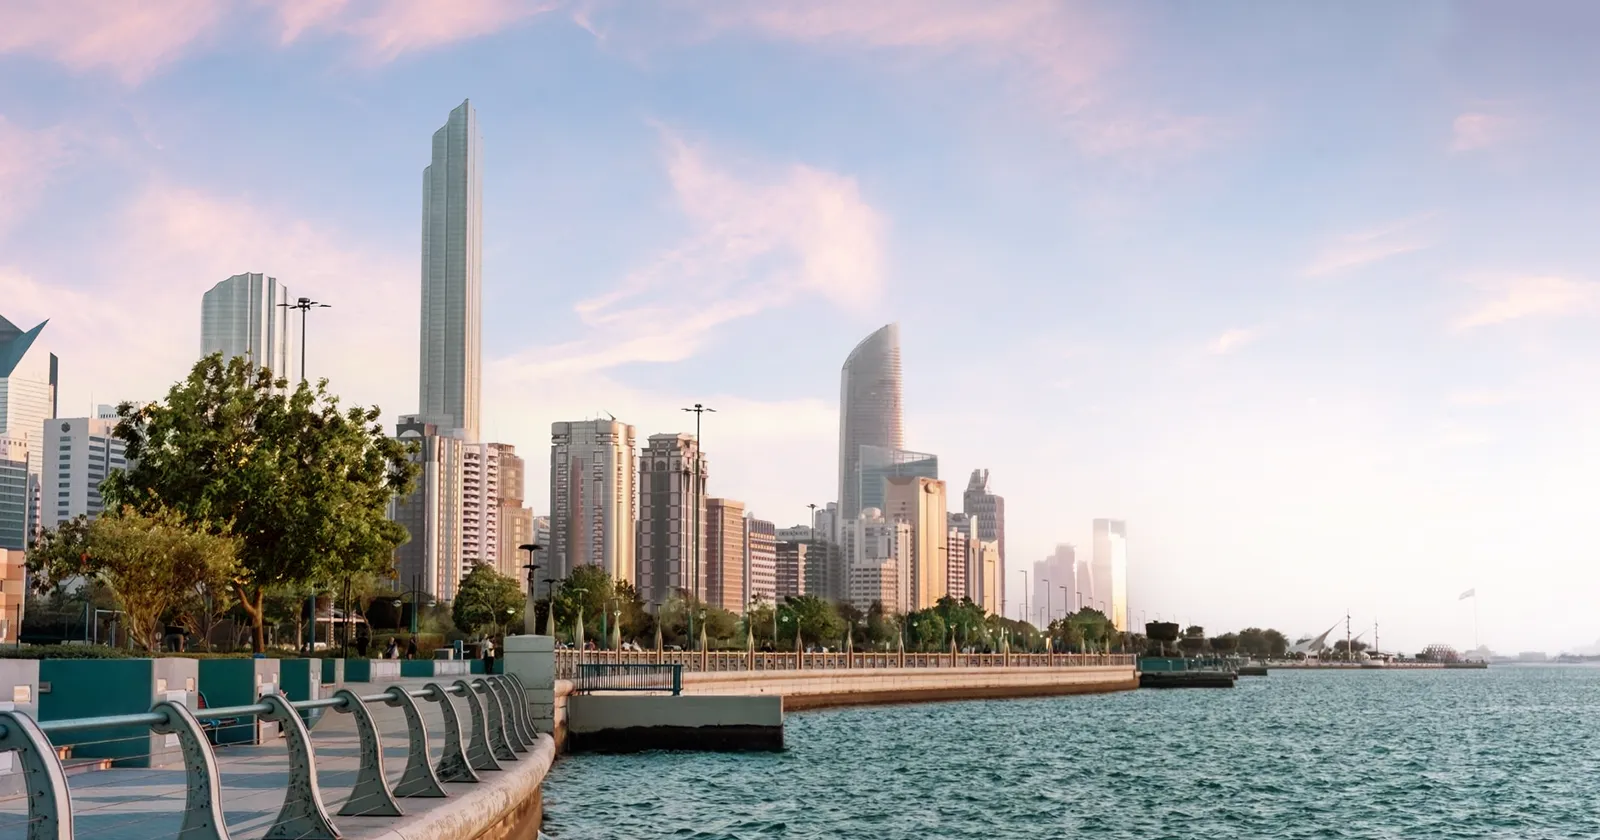
The United Arab Emirates
Abu Dhabi expands as Dubai recalibrates
The first-half totals conceal a sharp change in direction. Abu Dhabi continued to grow strongly, while Dubai moved through a significant price and transaction adjustment after February. June brought a notable recovery in ready-home sales, but not yet a return to broad-based price growth.
The UAE is moving out of a multi-year boom into a more mature cycle. It is still expanding, just at a slower rate, and the first half of 2026 was where this became visible.
Dubai recorded approximately AED286.4 billion of property sales across 86,000 transactions during H1. That is the second-highest first-half sales value on record, beaten only by the first half of last year.
Abu Dhabi did not slow at all, residential sales value rose 174% year on year and volumes doubled, putting it on course for its strongest year to date.
Price growth across the region stepped down from the double-digit surges of the previous two years as handovers arrived, with Dubai averaging AED1,841 per square foot and rents up 4.4% in the year to April. Villas and waterfront held their premium while apartment districts absorbed the new supply, and rents softened there first.
The UAE remains an attractive prospect
The UAE actively courts international capital rather than taxing or restricting it, and the results are clear to see. Dubai has issued more than 100,000 real estate investor family visas since 2021, and Henley & Partners forecast that the UAE would attract a net inflow of approximately 9,800 high-net-worth individuals in 2025, the highest of any country in the world.
Whilst the first half of 2026 was a sharp lesson was in how unevenly a regional shock travels, the underlying resilience of the region has been unveiled. The impact was particularly visible in March, when Dubai hotel occupancy fell 39.4 percentage points and revenue per available room declined 65.6% as air traffic was disrupted. By comparison, the residential property market continued to be active, and commercial demand kept building throughout.
Supply, and the strait
The consensus across CBRE, JLL, ValuStrat and Property Finder is for continued but measured growth. Transaction volumes should stay high in both emirates, with Abu Dhabi likely to keep outgrowing Dubai on a percentage basis as it matures from a smaller base.
Capital values are expected to rise at a single digit pace, with villas and branded residences ahead of apartments, and full year growth landing in the mid to high single digits rather than the double-digit rates of 2024 and 2025. Rental growth should slow further in the second half, concentrated in the apartment districts carrying the newest stock, while villa and low supply waterfront communities stay comparatively resilient.
Supply is a watch point rather than a crisis. Around 100,000 units are due across the country this year, concentrated in mid market apartments, though 30% to 40% of announced supply is historically delayed or phased. JLL expects roughly 59,000 units across both emirates for the remainder of 2026 and nearly 92,000 in 2027. That keeps the oversupply risk in specific mid market submarkets rather than across the market as a whole.
Geopolitics has moved since the half year data was compiled. Strikes on Iran resumed in mid July and the Strait of Hormuz is closed. Energy prices have risen and hospitality’s recovery now waits on flight schedules. The dirham’s peg to the dollar means UAE assets carry the dollar’s strength, which protects capital locally while raising the cost of entry for sterling buyers at exactly the moment London has grown cheaper.
Taken together, the UAE is moving out of a multi-year boom and into a more mature cycle that is still expanding. Absolute activity is high and the fundamentals are firm. Price and rental growth are settling toward sustainable single digit rates heading into the fourth quarter.
“The UAE is not moving in one direction. Abu Dhabi continues to expand, while Dubai has undergone a sharp post-February adjustment and only began regaining transaction momentum in June. The opportunity now lies in differentiation: strong locations and scarce homes should prove more resilient than apartment-heavy schemes facing substantial new supply.”
Sources: Dubai Land Department; Abu Dhabi Real Estate Centre; CBRE, JLL, ValuStrat and Property Finder; Bayut; Dubai Chamber; Henley & Partners.
Three markets, one behaviour
Llanover International operates across markets with different tax systems, political conditions and property cycles. Considered together, however, they reveal a common shift: broad averages are becoming less reliable as a guide to the performance of individual assets.
Across all three markets, broad averages are becoming less useful as a guide to individual asset performance. The divergence is clearest in Singapore, more selective in London and split sharply between Abu Dhabi and Dubai. Singapore’s prime core rose while the rest of the island fell. The UAE’s villas held their premium while apartment districts softened. London’s index fell 3.6% while sales above £5m rose 7.1% against a 17.3% fall in new instructions.
These are three different tax regimes, three different political situations and three different points in three different cycles. In all of them, at the same time, the best assets pulled away from the market beneath them. A citywide index no longer describes what happens at the top of these markets.
If you would like to discuss how these shifts affect a specific market, price bracket or asset, the Llanover International team would be glad to help. Get in touch.